
Data design (or “data visualization”) is the art of displaying information in a way that is easy to consume and easy to understand.
In our new course, Data Design With Chart.js, you'll get a comprehensive introduction to Chart.js, a powerful JavaScript library for dynamically displaying data using interactive and eye-catching charts.
What You’ll Learn
Envato Tuts+ instructor Craig Campbell will take you through the full process of creating several different types of chart in Chart.js. You'll start by creating a simple line chart and applying various styles. Then you'll do the same with other charts, such as bar charts, pie charts, and doughnut charts.


You'll also learn some skills that will really make your work stand out, such as adding animation effects, and creating more advanced charts such as radar charts and polar area charts.
Here are some free lessons from this course, as a preview of what you can expect:
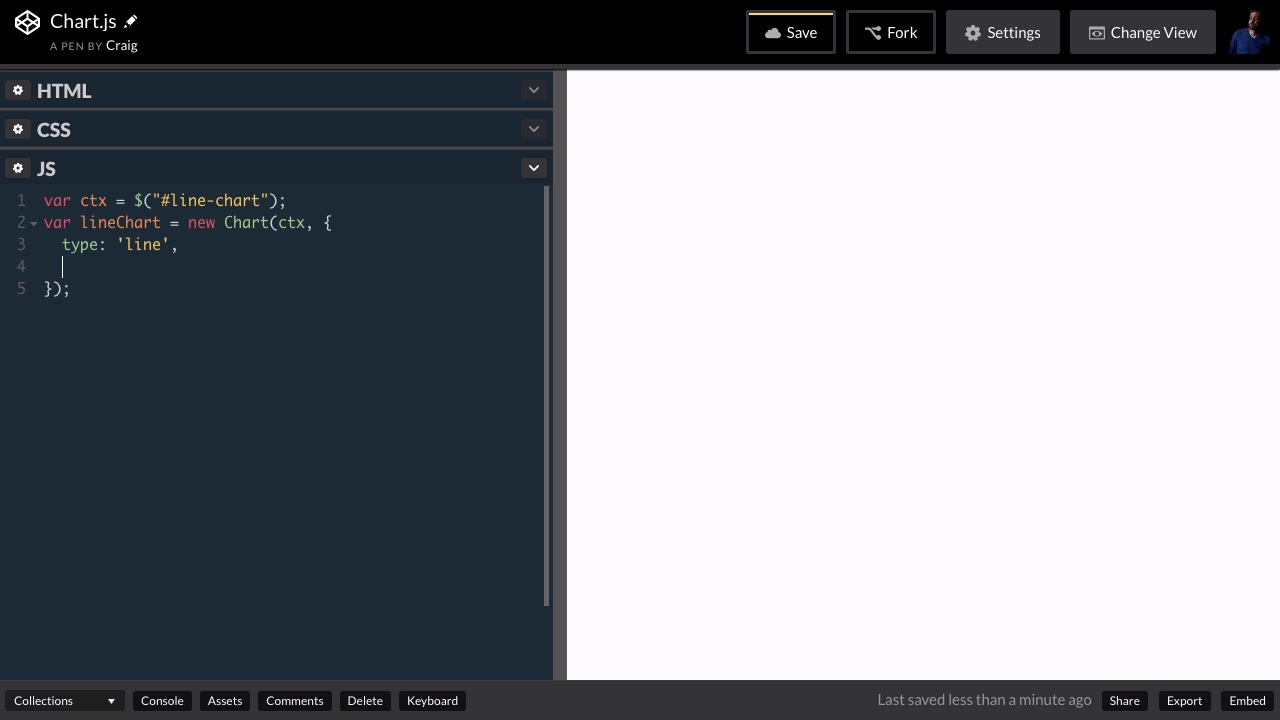
Creating a Simple Line Chart
In this lesson, you’re going to create your first chart by using the Chart.js framework to plot out a series of points on a grid. With that done, you can watch the Chart.js framework do the rest of the heavy lifting for you.
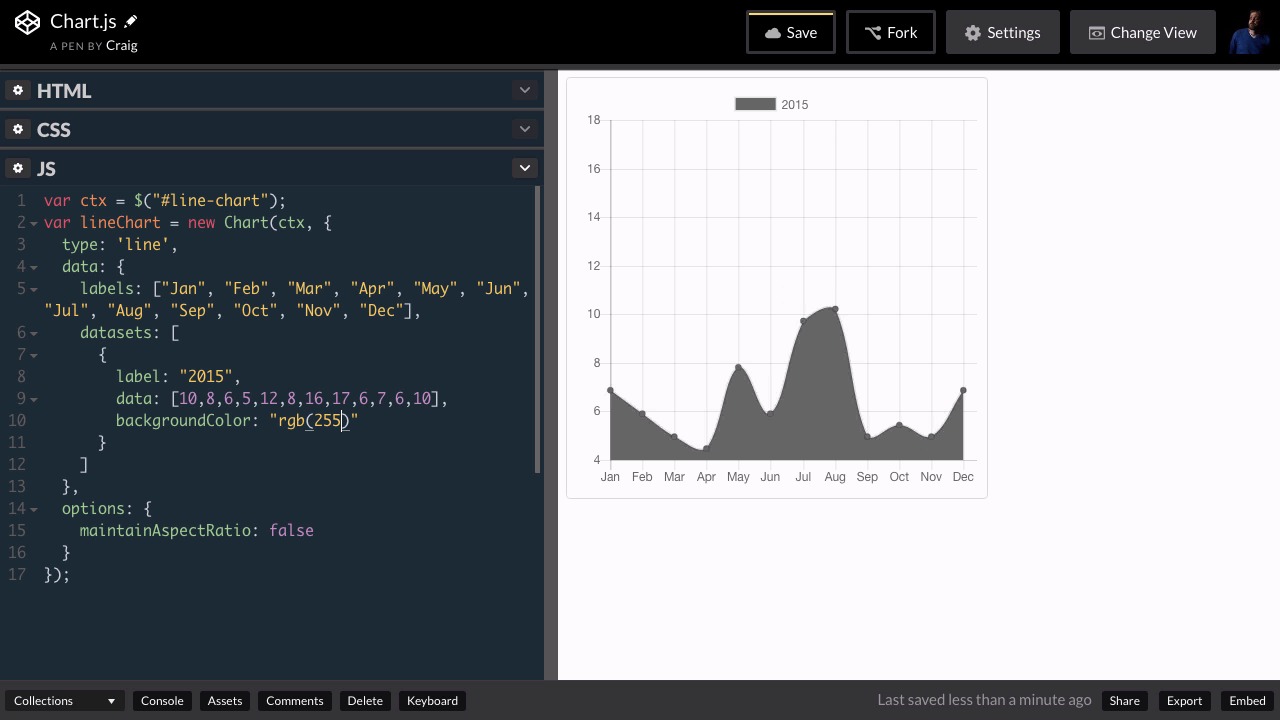
Styling Your Line Charts
In this lesson, you will take a look at a few different styling options you can apply to your line charts to adjust the colors and borders.
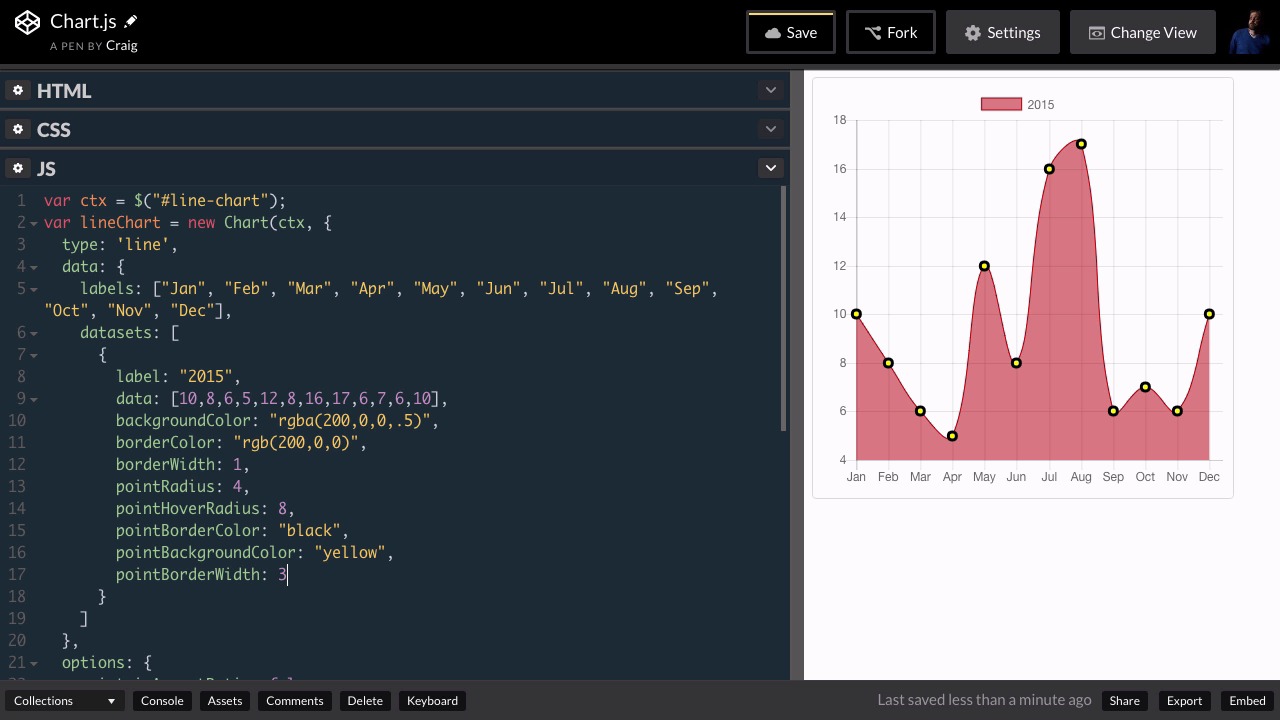
Styling the Data Points
In this lesson, you’ll learn how to use Chart.js to customize the color, shape, and borders of the individual points of data on your line charts.
You can take our new course straight away with a subscription to Envato Elements. For a single low monthly fee, you get access not only to this course, but also to our growing library of over 1,000 video courses and industry-leading eBooks on Envato Tuts+.
Plus you now get unlimited downloads from the huge Envato Elements library of 200,000+ photos and 26,000+ design assets and templates. Create with unique fonts, photos, graphics and templates, and deliver better projects faster.
Looking for a ready-made solution? Try Responsive Charts, a script from Envato Market that allows you to create HTML5 animated charts easily in WordPress:
- 7 animated chart types using Charts.js
- Allows for multiple charts on a single page
- Fully customisable charts and tooltips
- Multiple data sets for bar and line charts
- Import data sets from CSV
- Responsive
 By
By


