
 Lessons: 17Length: 1.3 hours
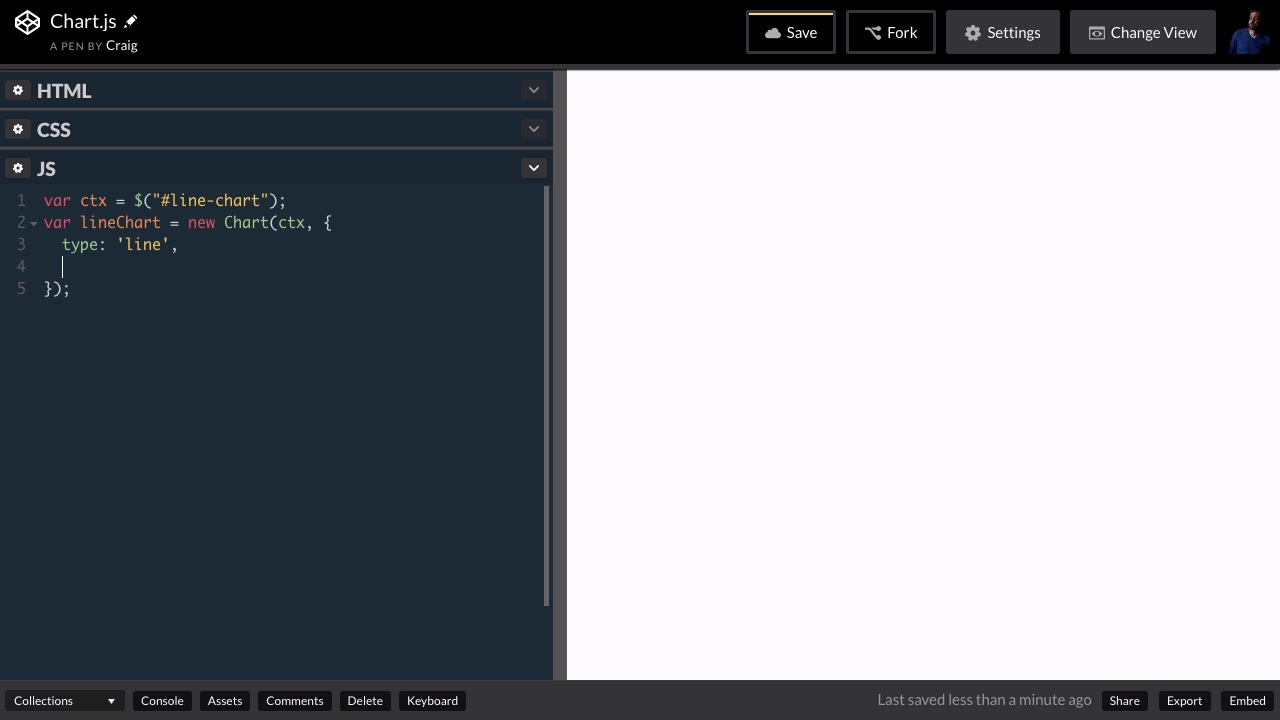
- Overview
- Transcript
2.1 Creating a Simple Line Chart
In this lesson, you’re going to create your first chart by using the Chart.js framework to plot out a series of points on a grid. With that done, we’ll watch the Chart.js framework do the rest of the heavy lifting for you.
Related Links
1.Introduction
1.1Introduction00:45
1.1
Introduction
00:45
1.2What Is Chart.js?01:31
1.2
What Is Chart.js?
01:31
1.3Setting Up Chart.js in CodePen02:56
1.3
Setting Up Chart.js in CodePen
02:56
2.Line Charts
2.1Creating a Simple Line Chart08:27
2.1
Creating a Simple Line Chart
08:27
2.2Styling Your Line Charts10:07
2.2
Styling Your Line Charts
10:07
2.3Styling the Data Points07:35
2.3
Styling the Data Points
07:35
2.4Comparing Data on a Line Chart05:28
2.4
Comparing Data on a Line Chart
05:28
3.Bar Charts
3.1Creating a Simple Bar Chart02:52
3.1
Creating a Simple Bar Chart
02:52
3.2Bar Chart Options03:21
3.2
Bar Chart Options
03:21
3.3Comparing Data on a Bar Chart05:19
3.3
Comparing Data on a Bar Chart
05:19
4.Pie and Doughnut Charts
4.1Creating a Pie Chart04:21
4.1
Creating a Pie Chart
04:21
4.2More Styling Options05:16
4.2
More Styling Options
05:16
4.3Global Options03:49
4.3
Global Options
03:49
4.4Doughnut Charts01:45
4.4
Doughnut Charts
01:45
5.Other Chart.js Features
5.1Other Charts05:37
5.1
Other Charts
05:37
5.2Animating Data06:41
5.2
Animating Data
06:41
6.Conclusion
6.1Final Thoughts00:34
6.1
Final Thoughts
00:34


