
 Lessons: 17Length: 1.3 hours
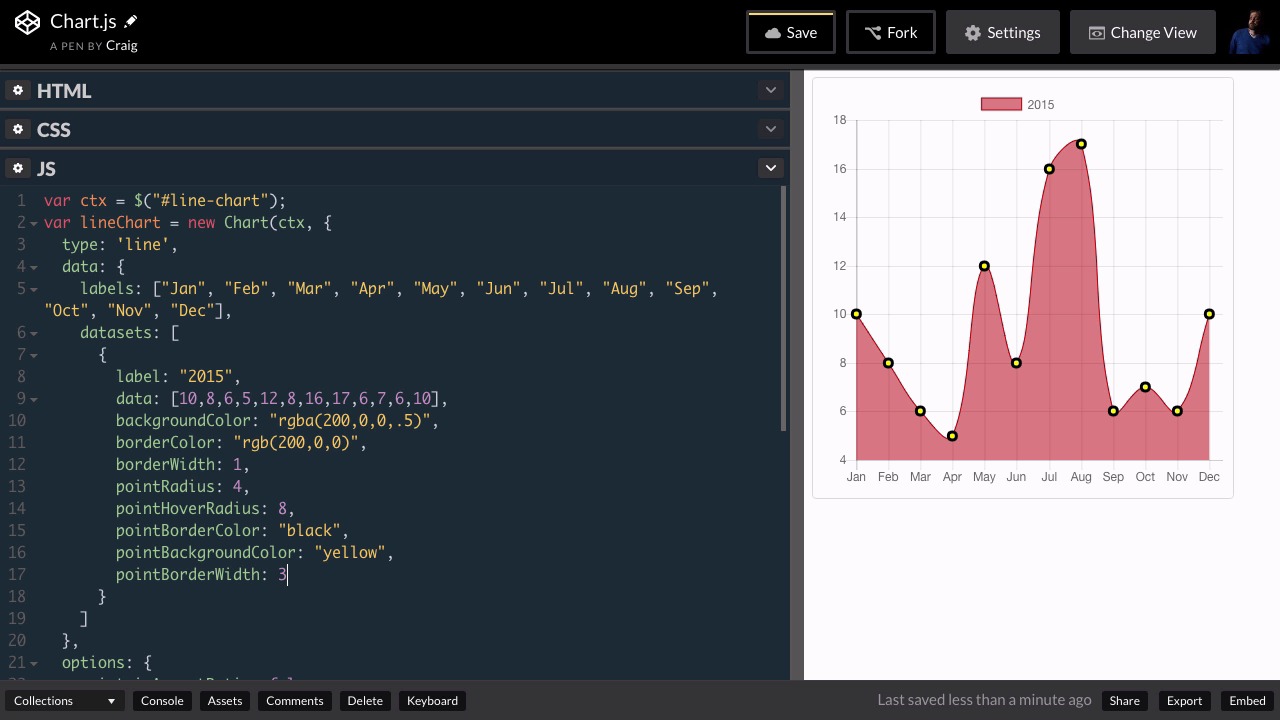
- Overview
- Transcript
2.3 Styling the Data Points
In this lesson, you’ll learn how to use Chart.js to customize the color, shape, and borders of the individual points of data on your line charts.
Related Links
1.Introduction
1.1Introduction00:45
1.1
Introduction
00:45
1.2What Is Chart.js?01:31
1.2
What Is Chart.js?
01:31
1.3Setting Up Chart.js in CodePen02:56
1.3
Setting Up Chart.js in CodePen
02:56
2.Line Charts
2.1Creating a Simple Line Chart08:27
2.1
Creating a Simple Line Chart
08:27
2.2Styling Your Line Charts10:07
2.2
Styling Your Line Charts
10:07
2.3Styling the Data Points07:35
2.3
Styling the Data Points
07:35
2.4Comparing Data on a Line Chart05:28
2.4
Comparing Data on a Line Chart
05:28
3.Bar Charts
3.1Creating a Simple Bar Chart02:52
3.1
Creating a Simple Bar Chart
02:52
3.2Bar Chart Options03:21
3.2
Bar Chart Options
03:21
3.3Comparing Data on a Bar Chart05:19
3.3
Comparing Data on a Bar Chart
05:19
4.Pie and Doughnut Charts
4.1Creating a Pie Chart04:21
4.1
Creating a Pie Chart
04:21
4.2More Styling Options05:16
4.2
More Styling Options
05:16
4.3Global Options03:49
4.3
Global Options
03:49
4.4Doughnut Charts01:45
4.4
Doughnut Charts
01:45
5.Other Chart.js Features
5.1Other Charts05:37
5.1
Other Charts
05:37
5.2Animating Data06:41
5.2
Animating Data
06:41
6.Conclusion
6.1Final Thoughts00:34
6.1
Final Thoughts
00:34


