

- Overview
- Transcript
2.4 How to Measure Animation Performance
It’s actually quite simple to measure the performance of your animations because all the tools you need are available in the browser. So I’m going to show you an animation, and then we’ll measure the performance in both Chrome and Firefox. Let’s go.
Related Links
1.Introduction
1.1Welcome to the Course01:31
2.Web Animation Performance
2.1An Introduction to Web Animation Performance04:46
2.2How to Achieve High-Performance Animations24:44
2.3How Browsers Work Behind the Scenes04:17
2.4How to Measure Animation Performance10:33
2.5CSS vs. JavaScript Animations06:42
2.6A Simple Example of Animation Optimization09:48
2.4 How to Measure Animation Performance
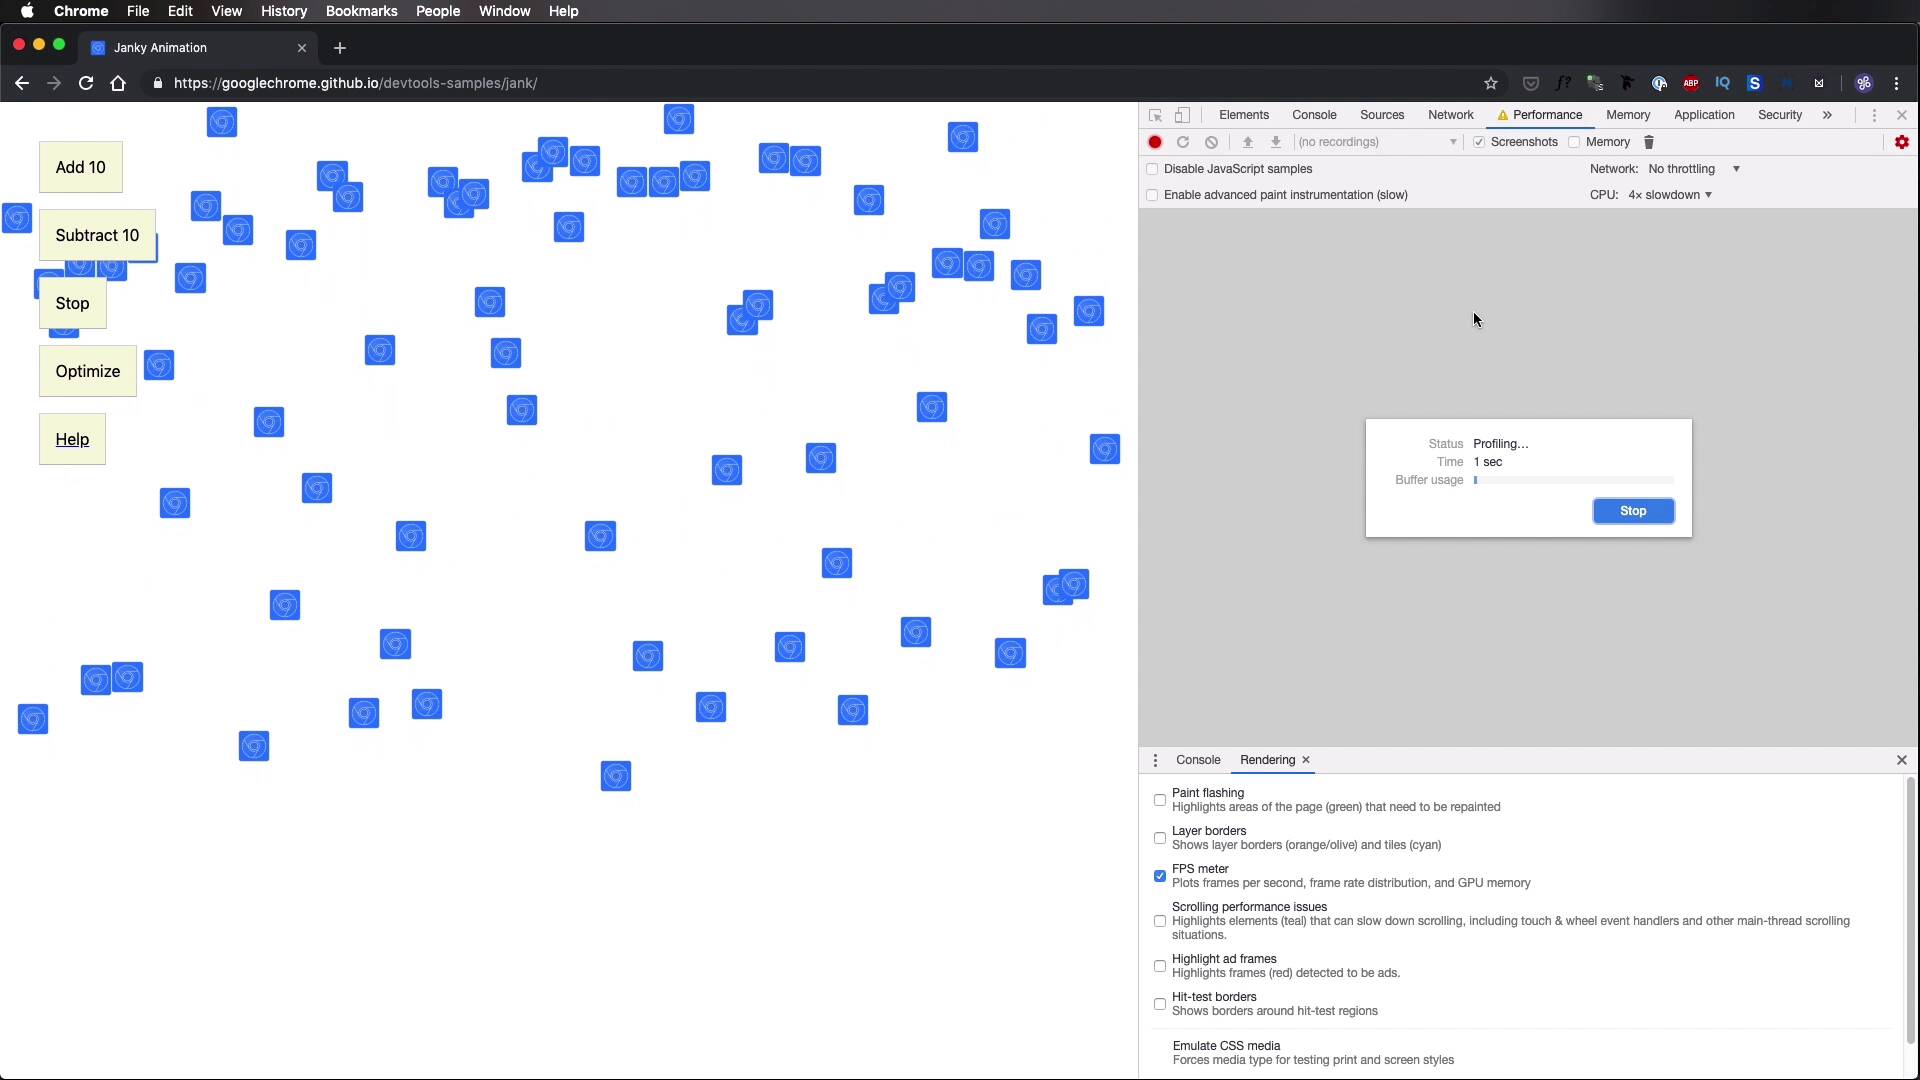
It's actually quiet simple to measure the performance because all the tools you need are already provided for free in the browser. So I'm gonna show you a demo animation, and I'm gonna use both Chrome and Firefox to do some measurements. Let's go. This is an animation provided by Google, and you'll find a link to it in the lesson notes. You can basically use these controls to add more element, and this is animated with JavaScript as far as I know. So it's gonna give us a good opportunity to get proper measurements. So what I'm gonna do is just add a bunch of elements here. And notice how the animation is not so smooth anymore. It got a little slower. Now, to measure its performance, open up the Inspector or the DevTools. Go under Performance. Okay, and this is actually very, very slow for my computer here. And what you do next is you either hit this little button, or you set Start Recording Performance. So now that's actually recording the animation, and you can see in real time how it's doing. We're just gonna record for a couple of seconds really, then I'm gonna hit Stop. And I'm actually gonna stop the animation as well and wait for the report here to finish. All right, so what do we see here? Well, first of all, we can see the maximum frames per second that were hit by our animation. 37, that's pretty low, that's a bad animation. The minimum was 6 FPS, which is even worse. And you can see from this graph the individual points, or the individual values of the FPS, as we're going along. And we got an average of 14.85 FPS, which is terrible, actually. But further down here, you can actually see all the operations the browser executed as we were recording the animation. So we started with a RequestAnimationFrame, which is actually the proper way to do animation with JavaScript. But then you see Paint, Paint, Paint, and you can see all of these here. So actually Google provided a way to optimize this with the click of a button. So let's do another measurement just for the fun of it. So notice, remember we had 14 frames per second. I'm gonna delete this. I'm gonna hit Optimize, and then Start. And already we can see this animation move a little bit better. Let's record a performance. I think that should do it. Okay, so now we got 39 FPS after loading the optimized code. So that's a very simple way to measure performance in Firefox. Now, I actually prefer Chrome for this because it gives you a little bit more insight. So I'm gonna open the same page in Chrome. And I'm gonna open the same thing, the Inspector. And if we have the rendering console or the rendering panel open here, we can actually check these boxes, Paint flashing, Layer borders, you can see which elements are on their own composite or layer. You can see the Paint events. You can also show an FPS meter, and it gives you an FPS reading in real time. So right now I'm at 60, which is perfect. But you'll see that as we start, Adding more and more elements. See the animation or the frame rate is now starting to dip a little bit. So let's add a couple more, and a couple more, and a couple more. So Chrome actually has some fantastic diagnostic tools. You can hit the Performance tab from the DevTools. And you can make sure Screenshots is checked if you wanna see individual screenshots from every frame. And you can open the settings here, and what I'm gonna do is simulate a low performance CPU. And you can throttle it down 4 times, 6 times, and I'm gonna throttle it down 6 times. So when I do that, notice, How bad the animation here is. I'm currently at 6 FPS, which is terrible. So actually, let's slow it down to 4x so we can actually get some readings here. So what you do is you hit Record. Just for a couple of seconds, let's say five seconds should be enough. Stop, and that's gonna load. Let me hide these. That's gonna load a very nice report here. Now, there are a couple of sections you need to look at. The first one is the FPS section right here at the top. If you look closely, there is a green graph or a green line on the bottom and a red line on the top. The goal here is to have the green line as tall as possible and not have any red lines. Red lines means the FPS dropped so low that the user experience was really, really bad. And you can see from this animation that it's terrible. So make sure you get this FPS as high as possible. The next section you need to look at is the CPU. So the CPU, what you see here is actually a representation of the summary here. This is what the CPU was doing during our recording. It was executing scripts. It was Rendering, Painting, System, and Idle. Now, what you want is very few colors in here. So the more uncolored it is, the better. Because the lack of colors means the CPU was idle, and that's always a good thing. It means it wasn't taxed, it didn't have a lot of stuff to do. Next, you can look at individual frames, where it says Frames here, and you can hover on each individual frame. And you can see just how much or how many FPS it had at the time. Currently you can see that I have 7, 8, 7 FPS, which is really, really bad. And then under Main, you can actually use the scroll to narrow down on a very specific section, and you can see the tasks that were executed. And tasks that are one above the other means that this, for example, Animation Frame Fired, triggered Function Call. Function Call triggered app update, and so on. Now, when you see this red triangle on the top-right corner, it means there is a problem with it. You can click it, and it's gonna tell you what the problem is. And it's gonna tell you where exactly in the JavaScript you have problems. And you can zoom in even further, and you can get to the Layout calls. And Chrome is smart enough, it tells you that forced reflow is likely a performance bottleneck. So you can click that right here, and click this bit to learn what it is, what you can do to improve, and so on. Now, just as a comparison, if we hit Optimize, right? And we do this again, we're gonna clear, and we're gonna record again for five seconds. You'll notice that we have a big difference here in FPS. Notice we don't have any more red bars. Instead, our FPS, or our green bars, are much higher. They're not quite at 60 yet, but it's an improvement. And on the CPU part, we have more idle time now than what we had before, which is an improvement. It's not perfect, but it's a very good thing. And so another thing, you can hover. If you had Screenshots selected here, you can now see screenshots from every single frame of your animation in here, which is pretty, pretty cool. So that's how you can use Chrome and Firefox to measure animation performance. Now, personally I prefer Chrome because I find their DevTools are a little bit better than Firefox's is. Maybe you can get this kind of insight in Firefox as well, I don't know. Maybe I missed that somehow. But yeah, Chrome, everybody uses Chrome nowadays. So having these tools built in is great, you can always measure performance with it. For more information or more details on the graphs that I showed you in the Chrome Performance tab, check out the lesson notes where I've included a link to the official documentation for DevTools. They explain those things in more detail there. Now, before we move on to the final lesson of the course, which shows a before and after example, I wanna briefly touch on CSS versus JavaScript animations. And that's coming up in the next lesson.


