
 Lessons: 17Length: 1.6 hours
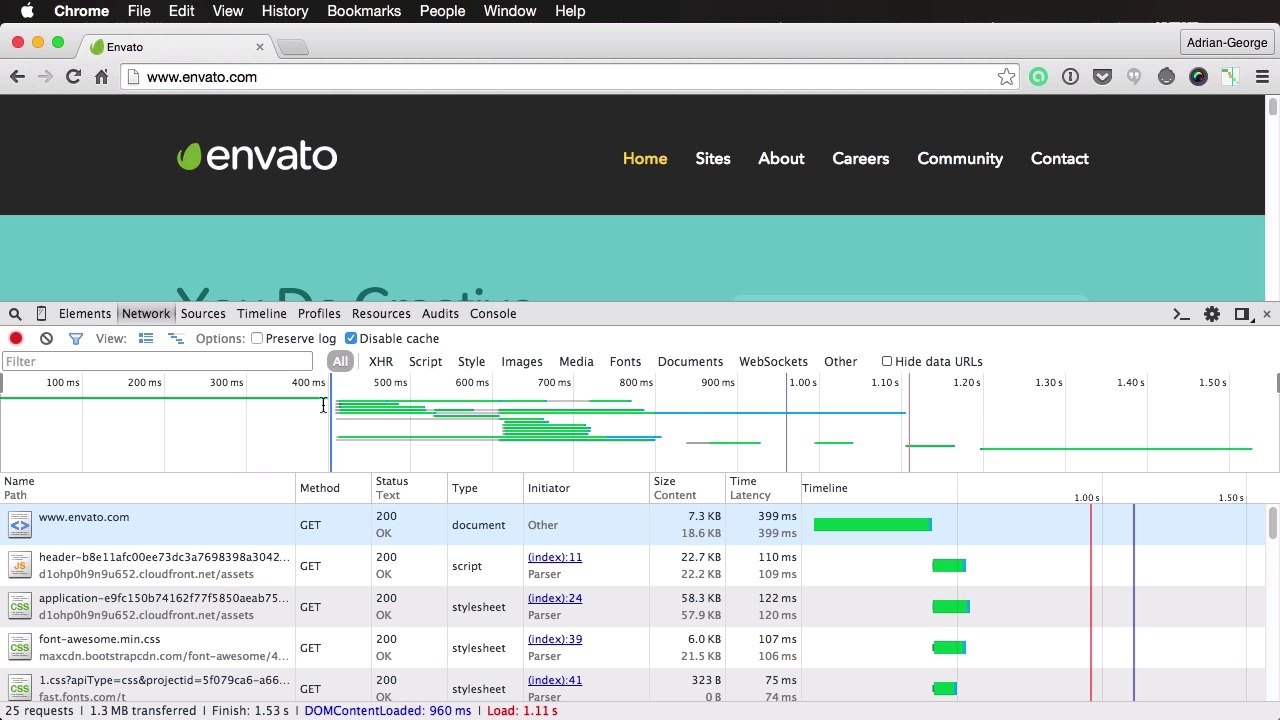

- Overview
- Transcript
2.2 Google’s DevTools
Let’s talk about the Google’s Developer Tools. A more accurate name would be “Chrome DevTools”, as they reside in the Chrome browser. In this lesson we’ll open up the tools and run through the basic features available.
1.About Website Performance
1.1Welcome00:34
1.2What Is Website Performance?03:42
2.Tools for Measuring Performance
2.1Overall vs. Perceived Performance02:32
2.2Google’s DevTools14:30
2.3Google’s PageSpeed Insights03:22
2.4YSlow and Pingdom Website Speed Test08:51
3.Overall Performance Optimization
3.1Server-Side Optimization05:06
3.2Reducing HTTP Requests03:56
3.3Image and Webfont Optimization07:37
3.4JavaScript and CSS Optimization03:31
3.5Moving Assets Externally03:23
4.Perceived Performance Optimization
4.1About Perceived Performance02:39
4.2Critical Rendering Path03:45
4.3Render Blocking CSS17:20
4.4Render Blocking JavaScript11:44
5.Platform Optimization
5.1Optimizing WordPress Websites02:27
6.Conclusion
6.1Final Words01:00
2.2 Google’s DevTools
Let's talk about Google's developer tools, or dev tools. And actually a more accurate description would be Chrome dev tools because they reside in Google's Chrome browser. The dev tools are basically a set of authoring and debugging tools you can use to inspect your page and learn information about the dom itself, the resources loaded and also the time it takes for those resources to load, among many other things. So it's pretty complete. If you want to do debugging or to optimize your code, this is a very good place to start. So let's have a closer look at dev tools. Now as I said, this is available in the Chrome browser, and you can access it by right-clicking anywhere in the page and choosing Inspect Element. Or using the key combination Cmd+Alt+I, or Ctrl+Alt+I if you're on Windows. And this will open this window that you can keep on the bottom or you can dock to the right. It just depends how you want it. Now inside this window you can see multiple tabs. First of all, the Elements gives you an overview of your HTML structure here. You can collapse or expand, rather, different elements, and you can click them and it will show you those elements in the page here. Now obviously I'm working with a small resolution here, so you don't see a lot of the page, but you can click this. You can even make changes. For example, if you want to change this text here, you can do that and it will update the page. Now of course, this change isn't permanent. It's just displayed for you here. Now the Elements tab doesn't really help you with performance optimization, so what we're gonna do is have a look at the other five or six elements here, Network, Sources, Timeline, Profiles, Resources and Audits. So let's start with Network. This is probably the one that you are gonna be using most. Now the network panel provides an insight into all the resources that are requested and downloaded in real time actually, so anything from CSS to images to scripts. Everything is monitored in here. So for example, let's do a refresh of the page. And you're going to see this bit. Now let's go over what's going on here. So on the top you have a couple of buttons here. This is the record button, so if you want you can stop recording the network log. This is the clear, so if I do this, I need to refresh the page again to get the log. Then this is the button for showing or hiding the filters here. That one's going to do that. Filters, of course, if I just want to see specific resources here on the left, I can do that. So for example, if I just want to see the images, I would just choose the images, or if I just want to see the fonts I would do that. Now here, of course, you have some more options that are not really important right now, like changing the height of the resources here. One important option here is to enable or disable the cache. So if you uncheck this, the resources the next time you're going to load the page are gonna be loaded from the cache instead of the server. So whenever you're monitoring performance and stuff, it's a good thing to keep this checked. Now here you can see the waterfall view, and this is actually toggleable from this button here. Now this will basically give you a visual indication of what's going on in your page, what resources are being loaded and when. And let's talk about these two vertical lines, the blue and the red. Now the blue, and you can actually see their counterparts here in the preview or in the status area. You can see the blue one stands for DOMContentLoaded. Now DOMContentLoaded is an event that fires when the browser engine has completed parsing of the main document. So when the DOM has finished parsing and has finished loading, then this event is fired. And if you're not sure what DOM is, well, it's the document object model, and it's basically the HTML structure, to put it simply. The red line stands for the Load event, and that's triggered when all the page resources are loaded. That means CSS, images, scripts, all that good stuff, fonts. So using these two, you can actually get a clear indication of what kind of performance your page has. So for example, in my case, the page completely loads here in 966 milliseconds, so just under 1 second, which is a very, very good time. Now of course, this depends on the network speed. If I refresh this again I will get a slightly different time, but it's around the same area here. Now this table here shows you all the resources that are being loaded. So if you scroll up you're gonna see right from the beginning this is the document. And then you start getting scripts, you start getting style sheets. You can see their type here. If you scroll down you can start seeing images, so if you click on one of these you can actually see a preview of it. This is the logo, for example. And all of these columns are actually customizable. You can right-click and choose which columns you want to show or which ones you want to hide. Now let's go over through the default columns here, so we have the Name and the Path. So this is basically the resource name and the path where it's loaded from. Then the Method, that's the method used to retrieve that resource. Status, it gives you the HTTP response status along with the text, so everything is okay here. Then the MIME type of the resource, whether it's a style sheet, whether it's an PNG file or a script. And then the Initiator here, you can see our page is, in most cases, the initiator. And then the size of that resource, the time it took. And then there's the timeline view, which is similar to what you see here on the top. But the difference is here you have some more details. So for example, if you hover on one of these you'll get some additional details, like waiting time that you can see here with the big green, and content loaded. Now you can actually click on this button to get an explanation. But to put it simply, the waiting time is the time for the round trip to the server, so from the moment you request the resource to the moment the server returns a response. And then the Content Download is the time it takes to download that resource. So you can see in most cases the waiting time is much bigger than the content download time. And if we actually scroll down here, let's find another example. Okay, so we have a jpeg file here that is 650 kilobytes, give or take. So you can see that the waiting time is actually smaller in this case because it's a rather large file. So it takes 188 milliseconds to request that file and to receive a response from the server, and then it takes 305 milliseconds to actually download that image from the server. So in some of these cases you can actually see the importance of optimizing the number of HTTP requests. Because even on the style sheets, you can see here, for example, it takes 77 milliseconds just in the waiting time for the server, and just under 1 millisecond to actually download that file. So the majority of the time spent to download the resource is the waiting time. So the fewer HTTP requests you're gonna have, the better. All right, so this is just an overview of the network panel here. Now let's go over some of the other ones. This one is Sources. Now the Sources tab is used to debug JavaScript basically, and you can use breakpoints. This is actually very important because nowadays JavaScript applications are getting more and more complex, so having a good debugger is a really great thing. And you can choose, you can hit Cmd+P, you can open a JavaScript file from here, for example, jQuery. If you want to debug that, you can do it right here. And of course, on the left you have a list of all the JavaScript files that are used in the page. Next up is Timeline. Now Timeline gives you a similar log to this bit here, but it is a bit more complex. So for example, you can hit Cmd+E or Ctrl+E to start recording, and then perform an action. So let's say I want to measure the page load. I would do that. I would hit Cmd+E again to stop recording, and then I get, as I said, a similar timeline. The only difference is you get more detail. So for example, here, on the left, you can see all the records. So you can see the very first event when I reloaded the page is Send Request. All right, so this is a request sent by the browser to the server for the HTML. Then you see the Receive Response, Receive Data, and then Parse HTML, which is a more complex process here. And then all the other events used to render the page. And you can see for a page like this, just how many events you have. And of course, you can click on one of these events. You can see a summary here. But this is essentially used to record and analyze the page activity, and it's not limited to just loading a page. So for example, if I hit Cmd+E again, and maybe I wanna see just how the page behaves when I use this slider. So if I click here, I can hit Cmd+E again and this will measure the activity that the page had when I switched that slider, so you can see all the events right here. Now the Profiles is basically used for memory usage. We're not gonna bother with this right now. Then Resources is used to inspect storage. So by using this tab you can actually see the resources that are loaded, including stuff loaded from databases, local storage, cookies and all that stuff. So you can actually see all the resources here on the left. So for example, if I can click on this cookie from Envato you can see the values and all the information from that cookie. Now finally, let's have a look at the Audits tab. And this is very interesting. So you can choose to select a Network Utilization or a Web Page Performance audit or both. And let's actually click Reload Page and Audit on Load. I can hit Run. So I reload the page, it's gonna inspect it basically, and it's gonna give me a report of what's going on. So the stuff in the red is actually of high importance and should be fixed. For example, here it could say, it says enable gzip compression, and it also gives you the amount of kilobytes that you can save by doing this. Then leverage browser caching, proxy caching and all that stuff, and this is for Network Utilization. If you go to Web Page Performance, here it tells you you can optimize the order of styles and scripts, and it actually tells you which files you need to work with. Then remove unused CSS rules, and then use normal CSS property names instead of vendor-prefixed ones. So it actually, again, gives you an indication here. So you can actually use this to kinda see what's going on with your page in terms of performance and what you can do to change it. Now the last tab is the Console tab. And again, when dealing with performance-related operations, this isn't really important. All right, so that is a very quick look at the Chrome dev tools. All right, and that's about it for this first tool you can use to measure performance. The next one also comes from Google, and it's called PageSpeed Insights. More about that in the next lesson.


