
 Lessons: 17Length: 1.6 hours
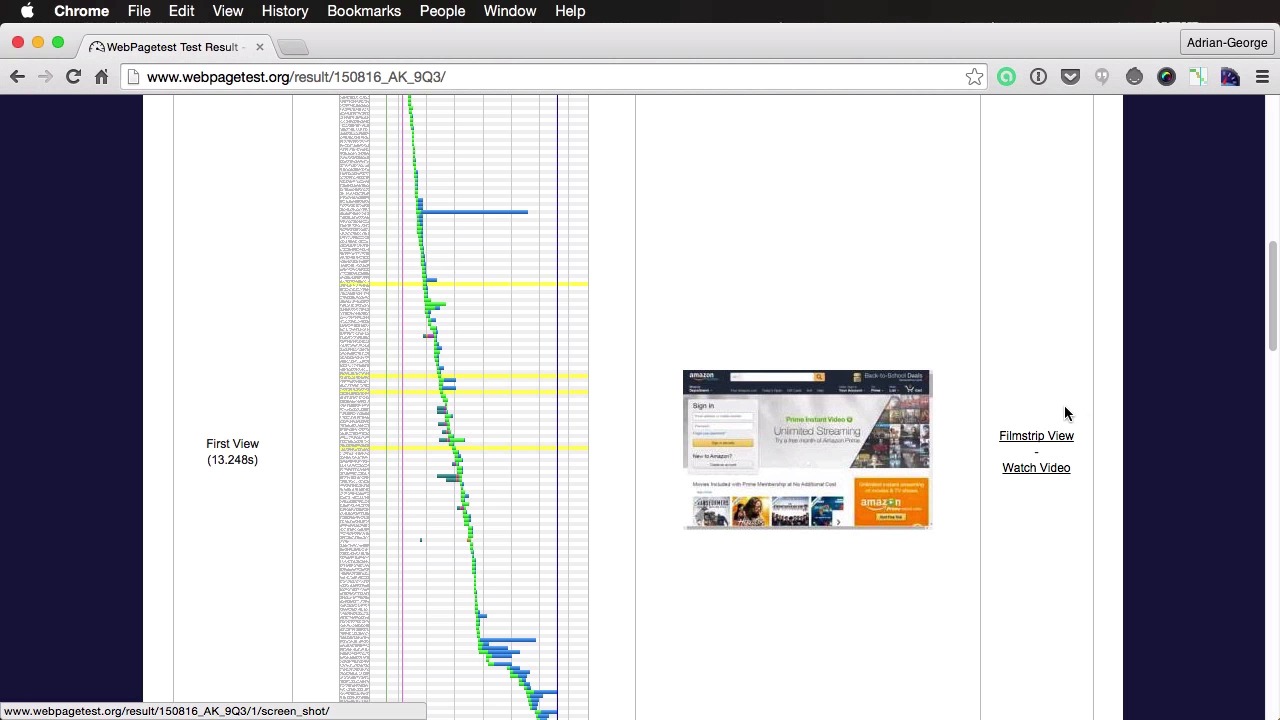
- Overview
- Transcript
2.4 YSlow and Pingdom Website Speed Test
In this lesson you’ll learn about some additional tools you can use to measure performance. We’ll talk about YSlow, WebPageTest.org, Performance Bookmarklet, and Pingdom Website Speed Test.
Related Links
1.About Website Performance
1.1Welcome00:34
1.2What Is Website Performance?03:42
2.Tools for Measuring Performance
2.1Overall vs. Perceived Performance02:32
2.2Google’s DevTools14:30
2.3Google’s PageSpeed Insights03:22
2.4YSlow and Pingdom Website Speed Test08:51
3.Overall Performance Optimization
3.1Server-Side Optimization05:06
3.2Reducing HTTP Requests03:56
3.3Image and Webfont Optimization07:37
3.4JavaScript and CSS Optimization03:31
3.5Moving Assets Externally03:23
4.Perceived Performance Optimization
4.1About Perceived Performance02:39
4.2Critical Rendering Path03:45
4.3Render Blocking CSS17:20
4.4Render Blocking JavaScript11:44
5.Platform Optimization
5.1Optimizing WordPress Websites02:27
6.Conclusion
6.1Final Words01:00
2.4 YSlow and Pingdom Website Speed Test
Another tool you can use to measure website performance comes from Yahoo, and its called Y slope. Let's have a look. You can find it at this address and its basically a browser extension and its available for Firefox, Chrome, so pretty much every browser here, and on this page you also get a few web performance best practices and rules. So you can actually take a look at that and see what's going on. So let's actually install this for Chrome. And lets open a webpage Amazon for example, lets click on this extension and it actually, it actually is a very big page so let me resize this so you can see it. Alright so here basically you can just run the test and it gives you an overall performance score, and then some recommendations here on the left. For example, make fewer HTTP requests, so it says the page has nine external JavaScript scripts. You should try combining them into a single one. Five external style sheets and seven external background images. And then it says try combining them with CSS Sprites, and then you can click on any one of these and it will give you an indication here. So this is a pretty good tool here. It also has a components tab. You can click on this. It gives you an overview of what kind of resources are loaded there. Statistics, you also get an overview of what's going on, so how many http requests, you can see 190 http requests, the total weight which is around eight megabytes here, and then a breakdown of those resources or of that weight using the different resource types. So all in all a pretty helpful tool. Next up we have a tool I highly recommend you use, it's called webpage test. You can find it at webpagetest.org. And originally, it was a tool developed by AOL for internal use. But it was made open source in 2008, I believe. And ever since then, it has been developed and maintained by Google. So let's check it out. This is a tool I've been using recently and it's pretty amazing. Let's do, for example, envato.com here. And the test has started. You need to wait for a little bit. And now it's complete. Now, this is a very nice overview of the performance, so we get all this information here like what's the total load time. It gives you how many DOM elements there are, and lots of other very useful bits of information. Now here, we can see a waterfall view. We can click on this, and you're going to see all the resources that are being loaded. Very similar to what we saw on the Chrome dev tools. You can see a screenshot, of course. You can see the content breakdown here, depending on the content type. Now, when doing a test, there are a few more options here. So for example, you can choose a test location, you can choose whether or not to use a mobile device, or just a regular internet connection, you have North America, you have South America, Europe, Asia and Australia for example, that region there. I can also select from the map, and then you can choose a browser that you want to use, and then you have some advanced settings. Like the connection here, you have even more options like DSL, dial-up, mobile, how many tests you need to run, whether or not to capture video, and this is actually a very cool thing I'm going to show you in just a little bit. And you can also do a visual comparison, so you can add multiple pages and compare them. But, let's actually do another test here using, for example, amazon.com. So I'm going to start the test using the exact same parameters that we used on the Invotto website, and it is done. Now, a part from the screen shot we also get an option here for video, and we can watch a video, or we can view a film strip. So, this is actually really useful, let's click on this. And what the film strip does, basically it gives you a view of what's going on on your website as its loading, so you can see here that it starts loading around 1.5 seconds, and this is how it looks like, and as it goes on you can see more and more elements are starting to get rendered on the page. Right, so, if we scroll all the way to the right we can see that the page is fully loaded in 15 seconds. Now, as we move on, as we scroll through this film's review, we can also see the red line scrolling here. And it can actually relate to all the resources that are being loaded by doing this. And from this view, we can actually export it as an image. You can choose the thumbnail size, we can choose the thumbnail interval, and this is really helpful when optimizing the perceived performance. We'll learn about that in a future lesson. But, for now, you need to know that this tool exists and it's highly recommended that you use it. Another tool you can use is called Performance Bookmarklet. And it's currently available as a Chrome extension and a Firefox add-on. >> Now this is very easy to use, you simply open the page that you want to inspect and then you click on the bookmarklet, and it's going to open an overlay. It's going to give you the number of requests, how many different domains you are using to load various resources from, the total time it takes to load the page, the time to the first byte done content loading, so similar to what we saw in the Chrome dev tools here. And you can actually see a little timeline here that shows some of this information in a more visual manner. The requests made by domain. And this actually works with the table below it. And then more information about the requests, initiator type, file type, and then you get a time line view for the resources, and then on the bottom a legend. So this is what the bookmarker does basically. Again, another tool that you can use to inspect a web page from a performance point of view. Finally, there is this tool called website speed test. It comes from a company called Pingdom, which created this performance monitoring solution for websites and web applications, so they created this tool and made it available for everyone to use, so let's have a look at it. To test this you would simply enter a URL here. All right, that was pretty fast. Gives you a grade, gives you the total number of requests, the load time and the total page size, and also the location it was tested from. So here we can see a waterfall view of all the resources, and then performance grade. You can also view a page analysis here with some statistics, and then the history. And this is pretty interesting, because it seems there were some previous tests done for enviro.com. You can see the dates here, and you can see the scores. It got, and you can actually see a history of the score and the request, the page sizes. So yeah, very interesting stuff. Alright, so that is the Pingdom website speed test tool. Alright, and that's about it for the tools you can use to measure performance. Now, I'm sure there are a few more tools out there. But, the ones I showed you are very well spoken for, and I actually use some of them. Now, coming up next, we'll start discussing the overall performance optimization and the best place to start is the server side. So, that's coming up next.


